


About two years into the pandemic, Europe faced a severe case of recession and unemployment. However, with the sustained use of job retention schemes and reforming economic policies, much of the continent is now on its path to recovery. This recovery, however, is uneven across the region. It includes underlying factors such as digitalization, inflation and automation.
This article will provide a thorough insight into how employment trends have varied in Europe and where they stand today.
Employment Statistics in Europe in 2022
Key Employment Statistics for Europe
- According to an article by the IMF European Department, unemployment in the EU declined to 6.2% in early 2022.
- The same article mentions the introduction of job retention schemes to reduce the rate of unemployment in the euro area. The unemployment rate is 2.5% lower than it would have been without these schemes.
- A news release by OECD states that in the OECD area, the unemployment rate amongst the youth fell to 13.9% in January 2022 (from 14.2% in December 2021) and will decline further. The OECD is a 38-member intergovernmental organization consisting primarily of European nations.
- According to Eurostat, the job vacancies in the EU were 2.9% in Q1 2022.
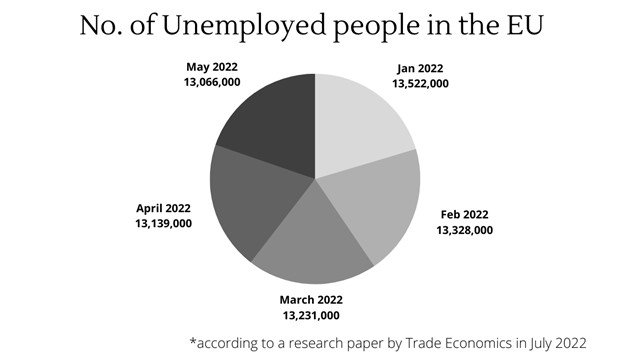
- A research paper was published by Trading Economics and sourced by Eurostat. According to the paper, 196,051 thousand people in the EU were employed in March 2022. This figure decreased from 195,503 thousand in February.
- The same paper mentions that 13,066 thousand people were unemployed in the EU in May 2022. This is a decrease from 13,139 thousand in April.
- According to European Union News published on Europe Sting, the updated labor rights guarantee more transparent working conditions for European workers. They have also been granted the right to know about key decisions, complete details about their jobs, and limited probationary periods.
How Many People are Unemployed in the EU?
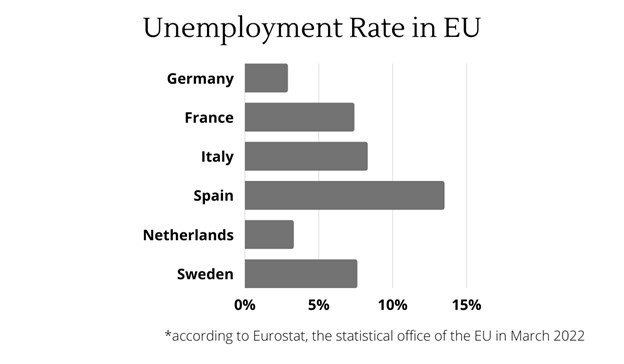
According to a study by Eurostat, the EU unemployment rate in March 2022 was 6.2%.
The study provides figures obtained from Eurostat’s statistical office in the EU, showing that 13,374 thousand people were jobless. 2579 thousand of these people were under 25 years of age.
Germany
2.9% of the labor force in Germany were jobless, whereas 5.5% of them were under 25. (Eurostat)
According to the Federal Statistical Office of Germany, the adjusted unemployment rate was 2.9% in March 2022. Based on the labor force survey, 1.26 million people were unemployed in March 2022, a decline of 435,000 (25.7%) compared to March 2021.
France
7.4% of the labor force in France were unemployed, whereas 16.3% of them were under 25. (Eurostat)
Based on data provided by Insee, according to the Labour Force Survey, the unemployment rate in France is stable at 7.3% in Q1 2022. So data by Eurostat and Insee are similar.
Furthermore, Statista shows that Northern France, the Occitanic region, and the Hauts-de-France region had the highest unemployment rate among all French metropolitan regions. It soared to 8.7%, compared to 5.8% in Bretagne.
Italy
8.3% of the labor force in Italy were jobless, whereas 24.5% of them were under 25. (Eurostat)
Similarly, according to CEIC Data, the unemployment rate in Italy dropped to 8.14% in May 2022, from 8.28% in Apr 2022.
Forecasts from Statista predict that this rate will drop to 9.9% in 2022 from a previous figure of 10.2 in May 2021.
Spain
13.5% of the labor force in Spain were jobless, whereas 29.6% of them were under 25. (Eurostat)
Conforming to predictive data from Focus Economists, the unemployment rate will be an average of 14.4% in 2022 and 13.5% in 2023.
Netherlands
3.3% of the labor force in the Netherlands were jobless, whereas 7.1% of them were under 25. (Eurostat)
Statistics Netherlands (CBS) noted an increase in unemployment at 323 thousand (3.3%) in May 2022, slightly higher than in April 2022, when the unemployed labor force accounted for 3.2%.
Concurrently, the growth in the employment rate is expected to fall further by 2023. Using research from ING, Staffing Industry Analysts measure the current growth as 4%, lower than the 7% in 2021. The reason is the risk of global recession paired with staff shortages.
Sweden
7.6% of the labor force in Sweden were jobless, whereas 22.3% of them were under 25. (Eurostat)
Based on CEIC Data’s evidence, Sweden’s unemployment rate was 7.66% in May 2022, a decline from the previously reported figure of 7.69% in April 2022.
Which European Country Has the Highest Job Opportunities?
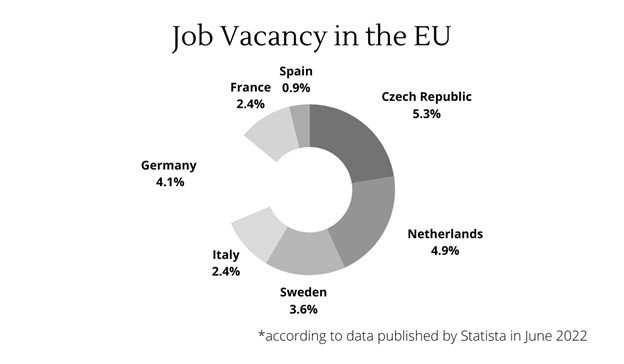
According to data published on Statista on June 20, 2022, the overall job vacancy percentage in the EU27 was 2.9%.
The Czech Republic has the highest job vacancy rate at 5.3% among the European countries. The Netherlands follows this figure at 4.9%. The list of the top 10 countries in terms of job vacancies in Europe is as follows:
- Czechia – 5.3%
- Netherlands – 4.9%
- Belgium – 4.8%
- Austria – 4.7%
- Germany – 4.1%
- Finland – 3.6%
- Denmark – 3.6%
- Sweden – 3.6%
- Norway – 3.5%
- Cyprus – 3.2%
What are the Most In-demand Jobs in Europe?
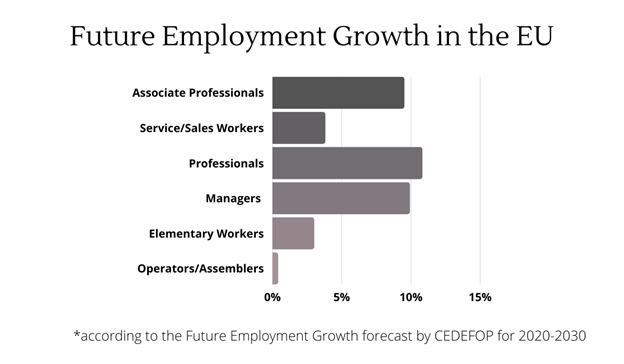
CEDEFOP published a forecast report about the most in-demand jobs in the EU.
The average employment growth (% change) during 2020-2030 is 1.2%. The minimum growth for an individual European country is -11.9 for Bulgaria, while the maximum is 23.6 for Cyprus. Along with Cyprus, Ireland is also one of the leading nations in this regard, with a forecast of 17.9% growth.
Professionals account for the highest growth of 10.8%, closely followed by managerial positions at 9.9%.
The growth rate for other positions includes
- Farm and related workers at -21.5%.
- Trade Workers at -2.9%.
- Clerks at -2.2%.
The report also categorizes employment growth sector-wise in the EU for 2020-2030, as mentioned below:
- The report estimates a growth of 11.9% in the ICT Services Sector alone. The maximum is 35.9% for Greece, whereas Sweden is at the lowest of -6%.
- The growth in the Education Sector is at 8.5%, with individual national growth levels of Cyprus at 35.2% and Slovenia at -7.3%.
- The growth in the Finance and Insurance Sector is at 5.8%. Romania leads at 23.6%, while Belgium is at -10.8%.
- The growth in the Non-Marketed Service Sector is at 8.9%. The maximum is 24.1% for Romania, and the minimum is -5.9% for Lithuania.
- The growth in the Manufacturing Sector is currently estimated at -1.3%. The maximum is 17.4% for Greece, and the minimum is -20.5% for Lithuania.
The report also provides a significant comparison of the employment growth rate country-wise. The highest is that of Cyprus, followed by Ireland, Luxembourg, Portugal, and Austria.
Cyprus
Cyprus has an overall employment growth rate of 23.6%.
Major growth can be seen in the Professional Services sector at 42.1%. This is followed by Transport and Storage at 36.1%, and then Education at 35.2%.
Ireland
Ireland has an overall employment growth rate of 17.9%.
Major growth can be seen in the Construction Work sector at 56.0%. Health and Social Care follow this at 33.2%, and then Professional Services at 30.3%.
Luxembourg
Luxembourg has an overall employment growth rate of 17.6%.
Major growth can be seen in the Administrative Services sector at 31.7%. Professional Services follow this at 28.7%, and then Education at 27.8%.
Portugal
Portugal has an overall employment growth rate of 9.4%.
Major growth can be seen in the Administrative Services sector at 36.1%. ICT Services follow this at 24.0%, and then Accommodation and Food at 15.3%.
Austria
Austria has an overall employment growth rate of 8.4%.
Major growth can be seen in the Public Sector and Defense at 17.2%. This is followed by Accommodation and Food at 16.9%, and then Education at 16.7%.
Netherlands
A survey by the Global Talent Bureau, cited by the NL Alumni Network, provides statistics about jobs in demand in Europe today. The Netherlands has the second highest demand for engineers globally, with about 13% of all job advertisements in the engineering sector.
An article by Visa Intelligence Consultancy on Linkedin in December 2021 also lists high-paying jobs in the Netherlands. Some of them, along with their average salaries, include:
-
Researcher (Clinical chemistry) starting at €210,000
-
Pilot starting at €155,280
-
Commercial Director starting at €127,920
-
Neurosurgeons start at €99,960
-
Dermatologists start at €99,960
Which European Country Has the Highest Employment Rate?
Germany
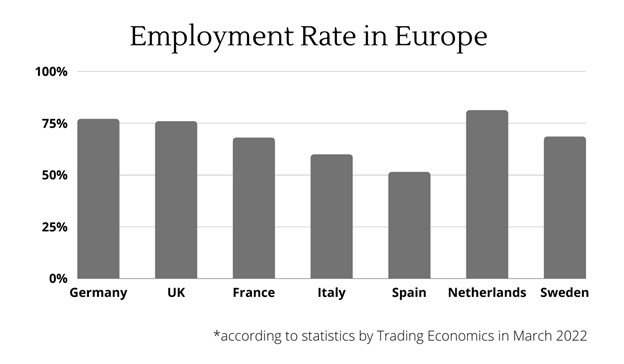
Trading Economics published a statistical chart based on Eurostat data containing European countries’ employment rates. Germany’s employment rate in March 2022 was 77% compared to 76.9% in the fourth quarter of 2021.
France
The National Institute of Statistics and Economic Studies of France, Insee, shows the overall employment rate in France. It increased to 68% in the first quarter of 2022, whereas in the fourth quarter of 2021, it was 67.80%.
United Kingdom
An article on CNBC states that Amazon plans to create 4,000 more permanent jobs in the U.K. in 2022. These jobs include those for software developers, product managers, and engineers.
According to the Office of National Statistics, the UK’s employment rate increased to 75.9% in April 2022 from 75% in March 2022.
Netherlands
The Netherlands’ employment rate in January 2022 increased to 81.2% from 81% in the fourth quarter of 2021. (Trading Economics)
According to Dutch News, European Labor Regulations stop employers from preventing workers from taking up second employment. This aims to make it easier to combine different jobs.
They also prohibit employers from claiming refunds for training courses taken by employees. Workers who quit before the end of the course will have to be paid for the classes taken.
Which European Country Has the Most Job Opportunities for Foreigners?
Germany
The ICMPD published a document harboring the concerns of irregular migrations to the EU in 2022. Germany and France have some of the most noticeable influx patterns.
A report by Schengenvisa News in July 2022 states that non-EU workers in Germany had increased by more than three times in the last ten years. This increase was around 226% by the end of 2021.
Regardless, there were still around 1.7 million job vacancies that Germany had to fill by January 2022. These vacancies were in the air travel and hospitality industry, where people migrating from India and Russia could be adjusted.
Czech Republic, Poland, and Estonia
An article by OECD in July 2022 predicts an increase of 0.5% of the immigrant labor force in the EU. The most significant addition is noticeable in the Czech Republic (2.2%), Poland (2.1%), and Estonia (1.9%).
United Kingdom
An independent report by GOV.UK estimated that total safety tech sector revenues hit £381m by December 2021. This, in turn, led to an increase of 30% of Full-Time Equivalent (FTE) employees from the existing 2850. Thus, more trained staff was required.
Full-time vs Part-time Employment Statistics in the EU.
United Kingdom
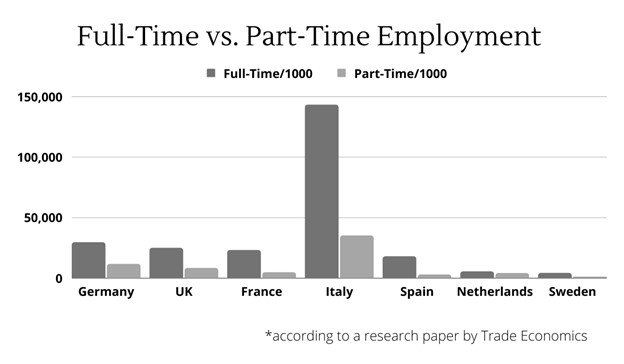
According to data published on Statista on July 22, 2022, there were under 8.2 million part-time workers in the United Kingdom just before May 2022. This figure is around 469,000 fewer than the number of part-time workers in the same period of 2021.
Another report by Statista mentions that there were almost 24.7 million full-time workers in the United Kingdom in May 2022.
The House of Commons Library published a document on July 19, 2022. It stated that in March-May 2022, 24.69 million people were full-time workers, while 8.18 million worked part-time.
According to the report by GOV.UK mentioned previously, a massive surge in revenue in the safety tech sector caused full-time employees to increase by 30%.
Italy
The Italian National Institute of Statistics, a public research organization, provided some statistics in a press release on 13 June 2022. Based on previous trends, full-time jobs rose by 1.3% and part-time employment by 1.1%.
Remote vs Office Employee Statistics in the EU.
Europe and EU Countries
A report published on Coresignal, a platform providing analytical data from professional companies worldwide, showed an overall depreciation in the trend of remote jobs in Europe, falling from 19.9% in October 2021 to a staggering 9.1% by February 2022.
The UK has had the highest percentage of remote jobs available since 2021, and this continues into 2022.
Furthermore, a study by LinkedIn Talent Solutions shows that in the past two years, the overall growth in remote jobs in the UK was 277%, the highest out of all European countries.
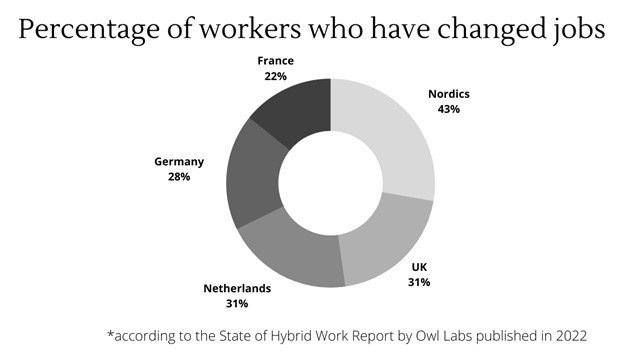
A State of Hybrid Work Report by Owl Labs contains key statistics about European remote work. The chart above shows the percentage of people who shifted jobs because of specific policies imposed in their workplaces. These policies are:
- Employers do not allow flexible hours (37%).
- They are not allowed flexible work locations (28%).
- Employers require employees to work in the office full time (28%).
- Cutting sick pay for unvaccinated staff (18%).
- Employers need employees to work remotely full-time (18%).
- Employers need employees to provide proof of vaccination (17%).
The same survey also provides the following reasons that have been convincing for employees to continue working at the same office.
- Flexible hours (36%)
- Four-day work week (36%)
- Flexible location (27%)
- Unlimited holiday (24%)
- Condensed hours (21%)
- Training and development (21%)
Germany
A study by NordLayer, a network security software group, deems Germany to be the best country to find remote jobs. Germany is more livable and has favorable work policies after the pandemic.
Germany scored 0.824 out of 1 GRWI (Global Remote Work Index), the highest out of all 66 countries in the study. Not to mention also having secured third place in overall cybersecurity performance through remote work.
Netherlands
The European labor regulations quoted by Dutch News give employees the right to ask for flexible working hours in the Netherlands.
According to the Bloomberg news agency, the Dutch parliament approved legislation establishing work-from-home as a legal right. Thus, the Netherlands stands as one of the first countries to grant remote working flexibility by law.
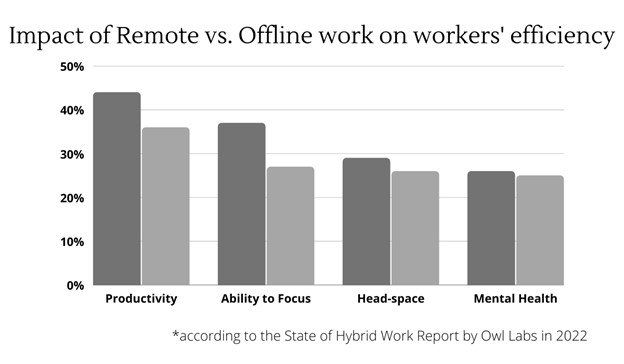
Many European countries have actively ensured their employees’ mental health and wellness support. They aim to manage a healthy hybrid workspace with maximum possible efficiency. However, according to the Owl Labs report mentioned above, it seems like ensuring mental health is more important for respondents in some countries compared to others.
- The UK – 36%
- France – 22%
- The Nordics – 26%
- Germany – 26%
- The Netherlands – 23%
Conclusion
We can infer from the data that European employment opportunities are increasing daily. Due to drastic variations in employment trends during the pandemic, this growth is relatively slow but still continuing.
Companies’ job retention schemes and rigorous efforts to facilitate remote workers, such as mental health and well-being policies, are becoming a noticeable trend.
Consequently, such initiatives will reduce unemployment significantly.
Additionally, a recent update in the European Labor Rights has allowed workers more freedom in choosing temporary and permanent jobs. They also hold the right to demand flexible working hours and thorough insight into essential details about their jobs.
Lastly, remote work is here to stay and befits both local and foreign employees, thus raising the employment rate even further.
In a nutshell, Europe is on a path to recovery with both a rising GDP and promising career opportunities.