

Manufacturing is a crucial sector of the global economy, responsible for producing goods that form the backbone of various industries. It is an industry that employs a significant portion of the workforce in many countries, and its performance directly impacts the overall economic health of a nation. As such, monitoring manufacturing employment statistics is vital in understanding the state of the job market and the broader economy.
In this article, we will delve into the latest manufacturing employment statistics, exploring trends and changes in employment in this critical sector. We will examine the impact of automation, globalization, and other factors on manufacturing jobs and assess the outlook for employment in the industry in the coming years.
Manufacturing Employment Statistics
Key Takeaways
- Manufacturing is a significant employment sector globally, with millions of people employed in the industry, highlighting its importance to the global economy.
- Advanced economies experienced a steady decline in their share of manufacturing jobs from 1970 to 2015.
- The decline of US manufacturing employment since 2000 has been attributed to weak housing and durable goods demand.
- Unfilled jobs in the manufacturing industry are due to shifting skills, misperception of manufacturing jobs, and the retirement of baby boomers.
Key Stats
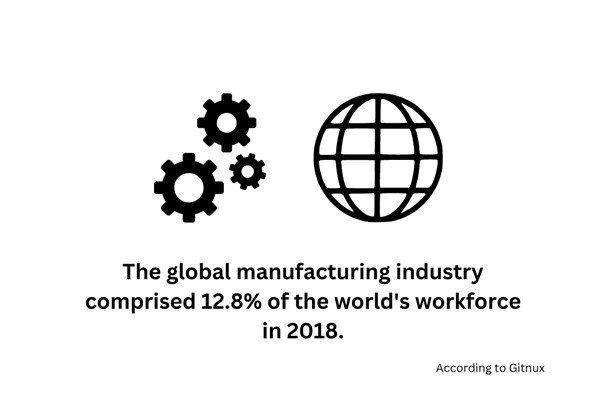
- According to a Gitnux blog published in 2023, global employment in the manufacturing industry was 12.8% of the world’s workforce in 2018.
- According to an S&P report, 17 out of 30 economies from the S&P global survey experienced higher employment in March 2023.
- Zippa stated in a 2021 report that the US had 164,350 employees in design manufacturing roles in the US.
- A 2019 post by Financial Post demonstrated the loss of 1.7 million jobs from 2000 to 2019 due to automation.
- According to a Deloitte post in 2019, 1.96 million US jobs were expected to grow by 2028.
Manufacturing Industry and Why It Matters?
The manufacturing industry is a grave part of the global economy. But what is the manufacturing industry? According to a Britannica post, the manufacturing industry uses raw materials to make products. They usually use labor or machinery to carry out this process. In simple words, it assembles components into finished goods.
The post further stated that the most important manufacturing industries include aircrafts, automobiles, chemicals, clothing and computers.
Britannica is a renowned publishing company famously recognized for producing the Encyclopedia Britannica, the world’s oldest continuously published encyclopedia, and a wide range of digital content.
Manufacturing plays a major role in the economy. The Corporate Finance Institute outlined the impact and measure of manufacturing in the economy. Its article on the industry stated that history provides evidence of the relationship between the industry and economic growth.
The report highlighted the importance of the industry stating many agencies use surveys of manufacturing companies to predict or estimate new orders, inventories most importantly, employment.
The Corporate Finance Institute (CFI) is a world-renowned provider of practical learning and productivity tools designed for finance and banking professionals.
Gitnux published a blog post in 2023 on manufacturing statistics. Employment statistics of the manufacturing industry are quite important, considering that global manufacturing employment in 2018 was 12.8% of the world’s total workforce (470 million). It stated that many nations employed millions of people in their manufacturing sector, which exhibited its importance to the global economy.
Gitnux is a digital platform that offers the latest software, HR, marketing, and business management trends, providing readers with quality content on various digital topics.
Manufacturing Industry Employment Trends
The manufacturing industry has been a significant source of employment globally for many years, playing a critical role in economic growth and development. However, the sector has undergone substantial changes in recent years, including shifts in employment patterns and regional differences in job opportunities.
Below, we will examine historical employment trends in the manufacturing industry, recent changes in employment patterns, and regional differences in manufacturing employment opportunities:
1. Historical Employment Trends in the Manufacturing Industry
The IMF published a report on manufacturing jobs in 2018. It stated that from 1970 to 2015, advanced economies experienced a steady decline in their share of manufacturing jobs. While emerging and developing economies’ share of manufacturing jobs have remained relatively low. The post stated that advanced economies were experiencing the disappearance of high-quality manufacturing jobs in their private sector.
The IMF Blog is a platform for sharing the perspectives and insights of the International Monetary Fund (IMF) staff and officials regarding critical economic and policy matters.
Due to a lack of further global data, we will explore data from the United States.
Urban Institute published a paper in 2018 on manufacturing employment in the US. It covered historical trends from the 1960s. It stated that the percentage of the workforce employed declined persistently from 1960 to 2015. Manufacturing workers’ total count rose consistently until the 1980s, after which it declined gradually throughout the 2000s.
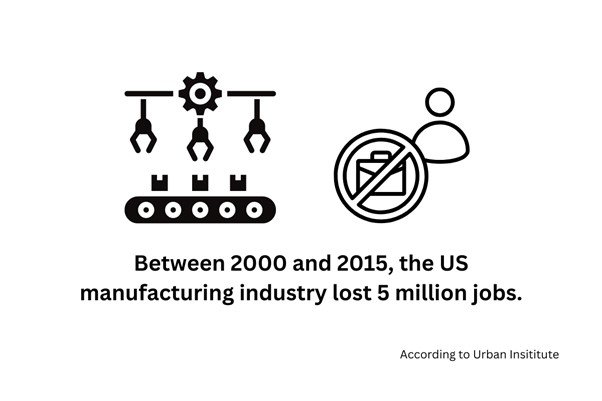
The paper posted an interesting fact, stating that between 2000 and 2015, the manufacturing industry lost 5 million jobs. This led to the number of jobs being even less than in 1960.
Another Urban Institute blog post stated that employment in manufacturing fell from 32% of the US workforce in 1960 to 11% in 2015.
Urban Institute is a think tank that conducts economic and social policy research to provide solutions and shape decisions.
Furthermore, the Gitnux post mentioned above stated that the US added 0.264 million jobs in 2018. These numbers were the highest since 1988.
The U.S. The Bureau of Labor Statistics published a report on the 40 years of manufacturing employment. According to the report, in June 1979, the manufacturing industry had employment of around 19.5 million. In June 2019, the manufacturing industry had employment of about 123.8 million.
Furthermore, a report by Deloitte stated that 89% of executives believe there is a talent shortage in the US manufacturing industry. The 2018 post reported that this percentage was 5% higher than the 2015 result.
Deloitte is an international company providing professional services.
Overall, the manufacturing industry involves using raw materials to create finished goods and has a significant impact on economic growth. It is often used as a measure to predict new orders, inventories, and employment. Previously, the manufacturing employed 12.8% of the world’s total workforce, indicating its importance to the global economy. The manufacturing industry is essential for providing goods and services that are necessary for daily life, and it plays a vital role in the success of businesses and nations.
2. Recent Shifts in Employment Numbers and Patterns
Global Shifts
Recent statistics provide an interesting outlook on employment statistics in manufacturing. S&P Global’s report reported on the global manufacturing labor market in 2023. Their PMI survey shows global manufacturing employment barely rose in March 2023.
PMI stands for Global Purchasing Managers’ Index. This data is the closely-watched market-moving economic indicators. Their PMI index revealed that only 8 out of the 30 economies covered by the surveys never saw employment growth acceleration in March. While higher employment was recorded in 17 of the economies, 12 of the economies experienced falling employment. Furthermore, only one economy was left unchanged out of the 30 covered by the survey.
Shifts in Canada
Randstad posted an article on the emerging manufacturing jobs in Canada. The report referenced a Statistics Canada report. In the report, they revealed that 47.4% of businesses in the manufacturing industry struggled to find skilled workers in 2023. This was an effect of the labor shortage in Canada.
Randstad is a Dutch multinational human resource consulting firm.
Furthermore, the report also stated that 85% of manufacturers had trouble filling open positions in 2023.
The Impact of the Pandemic
Moreover, an article by National Academies outlined trends in the manufacturing workforce. The report disclosed that the US lost 1.4 million manufacturing jobs during the recent pandemic. It mentioned that this reduced their manufacturing employment over the decade. They then noted that from February to June 2020, the labor market experienced sharp declines in the Northeast and Great Lakes region. The pandemic heavily hit both of these areas.
They reported that in 2021 the manufacturing industry added 0.952 million jobs. This recovered 69% of the jobs since April 2020. Yet, employment was 0.433 million less than the level from February 2020.
The National Academies is the national scientific academy of the United States.
It is interesting to see the shifts and changes in employment numbers and patterns in the manufacturing industry, both globally and within specific countries like Canada and the United States. The impact of the pandemic on employment numbers is evident. The need for skilled workers in manufacturing remains high, and it will be alluring to see how the industry continues to evolve and adapt to these challenges.
3. Regional Differences in Manufacturing Employment
Manufacturing differs across regions. The Gitnux blog mentioned above outlined the difference in employment numbers globally. The findings were as follows:
Europe
In the European Union, a union of 27 European countries, about 29 million people were employed in the manufacturing industry in 2020. The statistic is used as evidence to signify the sector’s importance.
On the other hand, the United Kingdom’s manufacturing industry employed 2.7 million people in 2019. Similarly, in 2020, Germany’s manufacturing sector comprised 5.5% of its total employment.
Asia
Asia hosts many countries, including China, which was reported to have almost 99 million people employed in the manufacturing sector in 2020.
In 2019, Japan’s manufacturing industry employed 9.95 million people. These statistics are intriguing since Japan has these employment figures despite technological advancements.
South Korea employed 4.6 million people in 2020. The blog stated that this shows that the sector is a major employer.
North America
Mexico, a country in North America, showed that in 2019, 14.7% of Mexico’s employment was in the manufacturing sector.
Moreover, Canada, a part of North America, employed 1.7 million people in their manufacturing industry in 2018.
South America
Brazil is a country in South America, covering half its landmass. In 2019, Brazil’s manufacturing employment represented 11.1% of its total employment.
Australia
Australia reached almost 0.86 million jobs in 2020. Interestingly, the blog mentioned that manufacturing employment in Australia remained strong during the 2020 pandemic.
The regional differences in manufacturing employment numbers paint an interesting picture. The statistics show that some countries heavily rely on the manufacturing industry for employment, while others have a lower percentage of their workforce employed in this sector. It is also noteworthy to see that some countries, such as Japan, have maintained high manufacturing employment despite advancements in technology. Overall, the manufacturing industry remains a significant employer worldwide, and its impact on the global economy cannot be ignored.
Job Categories in the Manufacturing Industry
1. Design Manufacturing Engineers
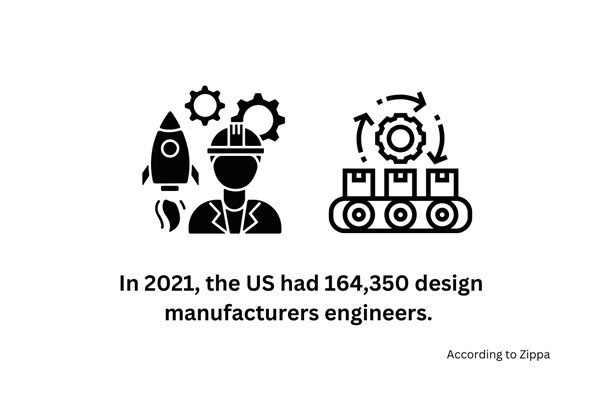
While there was a lack of data for specific job role statistics, Zippa posted a report. In it, they covered design manufacturing engineers’ statistics in the US. The 2021 report stated that there were 164,350 design manufacturers employed in the US. It also stated a 95 to 5% male-to-female ratio in the industry. It also outlined interesting facts about the industry stating the technology industry was the highest paying for design manufacturing engineers.
Zippa is an online recruitment company.
2. Production Workers
On the other hand, the U.S. Bureau of Labor Statistics summarized employment by occupation in 2021. According to the report, production workers in the US were 136,260.
3. Inspectors, Testers and Sorters
The report mentioned above also stated that Inspectors, testers, and sorters had employment of 359,350 in the US in 2021.
4. Machinists
On the other hand, the report containing occupation by employment stated that Machinists were reported to include 279,310 employees in 2021.
5. Purchasing Agents and Retailers
According to the U.S. Bureau reports, purchasing agents were 104,160 in 2021 in the US.
6. Team Assemblers
Finally, the report recorded 987,440 employees under the team assemblers occupation in the US in 2021.
Factors Influencing Manufacturing Employment
Numerous factors, including economic conditions, technological advancements, environmental regulations, and changes in trading policies, have influenced the manufacturing industry. These factors have significantly impacted the manufacturing industry, shaping its development:
1. Economic Factors and Market Demand
ECommons published a study in 2008 on the underlying factors that have affected the US manufacturing industry’s employment since 2000. While the investigation is dated, we can extract these factors’ effects on the industry and potentially conclude their current effects.
The study stated that the decline since the middle of 2006 could be significantly associated with the weak demand for housing and durable goods. The decrease could have also been associated with the then ongoing restructuring in the auto industry, which had been affected by the high gasoline prices.
Moreover, the study attributed the decline to two interlinked developments. Firstly the gain in productivity in the form of output per hour in the US manufacturing industry. Secondly, the increased competition from foreign producers – which is mentioned in the globalization and trade section.
2. Rise in Productivity
The short and long-term periods are associated with 2000 and 1950. Interestingly, the two time periods hosted the rapid growth of productivity in the manufacturing industry. The increase in productivity in these periods was associated with a significant portion of the decline in manufacturing employment and hours.
The study stated that the pattern of job losses and gains across many industry sectors differed from earlier declines in manufacturing employment. It noted that a smaller percentage of the decline in manufacturing jobs resulted from job losses than in the past. However, those who experienced these job losses experienced longer periods of unemployment and greater loss of income than workers from the previous decade from 2008.
3. Fall in Domestic Demand
On the other hand, demand played a major role in the industry’s employment. The article acknowledged that weaker demand in the US for manufacturing could’ve explained the decline in manufacturing employment, which occurred from 2000 to 2008. However, it stated that this factor only played a small role.
The study mentioned that the nominal domestic demand of US residents for manufactured goods did experience a sharp decline during the 2001 recession and recovered slowly. Through 2007, however, the measure returned to the trend from the expansions of the 1990s.
While the study acknowledged that some sectors may have experienced a weaker demand during the period due to weak demand, it also stated that many sectors faced the issue due to the problems of the housing market and auto industry problems. It noted the decrease in domestic demand might not be responsible for the broader and long-term decline in manufacturing employment.
ECommons is a digital repository that preserves and provides access to Cornell University’s scholarly and creative works.
4. Trade Policies and Globalization
The eCommons paper mentioned above stated that competition from overseas did help boost US firms’ productivity. However, it also reduced the demand for goods produced in the US. Even though domestic manufacturers tried to reduce costs through increased productivity, they could not increase their demands.
Manufacturing imports increase competition for the manufactured industry notably, especially competition from emerging economies. The competition stems from low wages earned by workers in emerging economies and rapid growth overseas.
Exports of manufactured goods from the US rose by 58% between 1999 and 2007. However, their imports grew much more. A staggering 78%. This affected the nominal trade deficit causing it to double during the period.
5. Technological Advancements
Over the years, automation has taken over the manufacturing industry. According to the Gitnux post referenced above, approximately 0.396 million robotics were employed in the auto-manufacturing industry by September 2021.
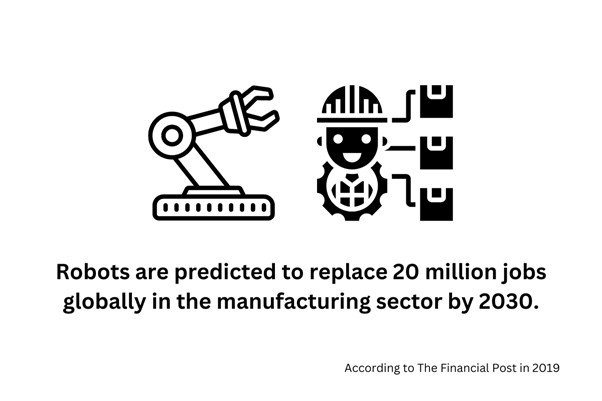
A 2019 post by Financial Post revealed globally, 1.7 million jobs were lost to automation from 2000 to 2019. Moreover, it also stated that robots were predicted to replace 20 million jobs globally by 2030. This shows the effect of automation on the jobs that potential employees could’ve filled.
Randstad referenced the statistics mentioned above in their article in 2023. However, they stated that automation wouldn’t reduce hiring demands for employers. Instead, as automation increases, the need for workers with high-level digital skills will also increase.
The article also mentioned that technology would allow for remote ways of maintaining systems and reduce the need for on-site staff. Furthermore, companies will require cybersecurity employees.
Financial Post is a news outlet that provides the latest breaking news, updates, and headlines on national and international events. Randstad Is a multinational HR consulting firm.
6. Hiring Process
The eCommons post mentioned above covered the hiring process that affected manufacturing employment. According to the study, the decline in manufacturing employment from 2000 to 2008 resulted from the absence of new hires. Not only were the rates of job losses low but so were the rates of job gains from 2001 to 2008, and the 1990s.
In the late 1990s, the rate of job creation began to fall. Once it dropped in 2001, it never recovered at the very least till 2008. By 2008, the job creation and job destruction rates were significantly lower in manufacturing than in the rest of the economy.
The phenomenon mentioned above could be seen at individual levels, where the rate at which workers voluntarily or involuntarily left their jobs was lower in manufacturing than in the rest of the economy. The hiring rate was much lower in manufacturing than elsewhere in the economy.
The report further mentioned that the overall displacement incidents from manufacturing employment were low between 2000 and 2007. The effects of displacement, however, were severe. Workers that had been displaced from manufacturing jobs and who had held positions for three or more years were lower between 2005 and 2007 than during the boom of the late 1990s.
Manufacturing workers were also reported to be more likely than other workers to be displaced and were more likely than their counterparts from other industries to remain jobless. They were also more likely to deal with significant earnings losses if re-employed. Additionally, the re-employment rate for displayed manufacturing workers has deteriorated significantly since 2000. Their declining rate was more than the rate for other displaced workers.
In summary, the decline in US manufacturing employment since 2000 is attributed to several factors, such as weak demand for housing and durable goods, restructuring in the auto industry, increased competition from foreign producers, globalization and trade policies, and automation. While automation may reduce the need for some jobs, it will also create a demand for workers with high-level digital skills and cybersecurity experts. The hiring process in the manufacturing industry played a crucial role in the decline of manufacturing employment. Additionally, the effects of displacement were severe, with manufacturing workers more likely to remain jobless and experience significant earnings losses if re-employed.
Future Outlook for Manufacturing Employment
As we look ahead to the future, it is important to consider the outlook for manufacturing employment. While some industries within the manufacturing sector may see a decline in employment opportunities due to factors such as automation and outsourcing, some areas are expected to experience growth and demand for specialized skills.
Potential Growth Areas within the Industry
Deloitte published a report in 2018. The study’s data was conducted in the US. According to its findings, jobs in manufacturing are expected to accelerate and grow by 1.96 million by 2028.
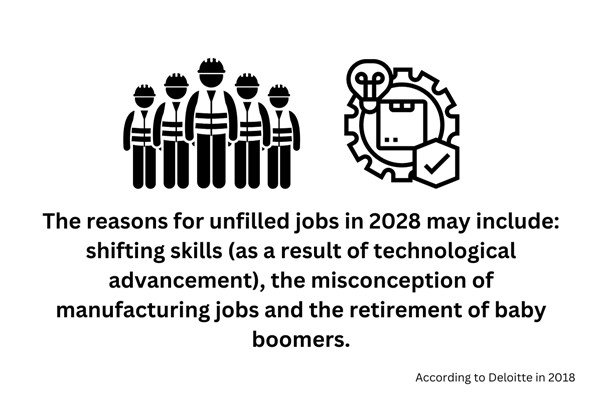
Furthermore, according to the above-mentioned Deloitte report, the average retirement rate was 66 years in 2018. The age of retirement means that more than 2.6 million baby boomers were expected to retire from manufacturing jobs in the decade following 2018. Moreover, more than half of the open positions in 2028, which is 2.4 million, were expected to remain unfilled in the US. The reasons for these predicted unfilled jobs were due to:
- Shifting skills due to technological advancement
- Misperception of manufacturing jobs
- Retirement of baby boomers.
Shifts Toward Advanced Manufacturing Techniques and Their Impact on Employment
The financial post report mentioned above did not just predict the jobs robots would replace. Instead, they offered insight stating that rural manufacturing-centric economies would be impacted more by the shift towards AI, machine learning etc., in manufacturing.
Initiatives
The future of the manufacturing industry is of much importance. A post by Davis Companies considered the future outlook of the industry. There have been steps taken to fill the number of unfulfilled jobs predicted. The initiatives were:
- The MI and the National Association of Manufacturing had teamed up to launch Creators Wanted. It was a virtual event that showed all the opportunities for work in manufacturing.
- The MI’s STEP Women’s Initiative was also launched and recruited and retained more women in manufacturing through research, mentorship etc.
- Employers had been personal steps, such as clarifying career opportunities. They offered ways to move up the organization. This would include upskilling.
- Many companies decided to offer more flexible hours for workers to attract talent.
Davis Companies is an experienced real estate investment and management company with over 46 years of history.
FAQS
What is the highest salary in manufacturing?
According to Ziprecuiter, in 2023, the best manufacturing jobs can pay up to $196,000 per year. It stated that the job of Vice President of Manufacturing can pay about $120,000 to $196,000 a year.
How has manufacturing employment changed over time?
According to the Bureau of Labor Statistics, in 2019, the manufacturing industry fell through each of the five recessions after 1979, and thus employment never fully recovered to its pre-recession level.
What factors influence manufacturing employment?
According to Plant Services in 2020, manufacturing employment results from employees not staying with a company as long as they used to, the profession’s knowledge base reaching retirement age, and the failure to attract young talent.
Which regions have the most manufacturing employment?
A Brooking post in 2018 stated that Poland had the highest percentage of workers in the manufacturing industry.
What is the future outlook for manufacturing employment?
According to a Revolutionized post in 2021, every manufacturing job will change rapidly from the initial inquiry to the final invoice.
Conclusion
Manufacturing employment statistics are a crucial indicator of the health of the manufacturing industry, one of the most important sectors of the global economy.
Over the years, the manufacturing industry has undergone significant changes due to globalization, automation, and digitalization. These changes have resulted in a shift in manufacturing employment trends. While there has been a decline in manufacturing jobs in some countries, others have seen an increase in manufacturing employment.
The future outlook for manufacturing employment is uncertain, as several factors affect it, including technological advancements, globalization, and demographic changes. Adopting advanced manufacturing technologies such as artificial intelligence, robotics, and the Internet of Things will likely significantly impact manufacturing employment in the coming years.
In conclusion, manufacturing employment statistics are a critical indicator of the health of the manufacturing industry and the overall economy. Understanding the trends, job category statistics, and factors affecting manufacturing employment is crucial for policymakers, educators, and industry leaders to develop strategies that support job growth and promote innovation in the manufacturing industry. It is essential to continue monitoring manufacturing employment statistics to ensure the sector remains competitive, creates good jobs, and contributes to economic growth and prosperity.