


Gender disparities in workplaces are a major problem faced by today’s world. Across the globe, females are severely underrepresented in most occupations. They are less likely to participate in the labor force and also less likely to find jobs. When women find jobs, they have unfavorable working conditions and limited opportunities, allowing men to progress more in their careers.
Male vs Female Employment Statistics
Key Takeaways
- As BioMedCentral states, women are more likely to be employed with lower salaries, less chance of promotion, and worse social protection than men. These disadvantages in the labor market force women to have lower job expectations.
- The Statista Research Department published data in October 2022, showing the employment rates of males and females worldwide since 2000. Employment rates of males have been consistently higher than women, the gap barely narrowing in the two decades.
- According to a Frontiersin report, Science, Technology, Engineering, and Math (STEM)-related professions are traditionally male-dominated.
Key Stats
- The World Bank published data comparing female to male labor force participation rates based on ILO statistics from 1990 to 2021. The ratio rose from 67% in 1990 to around 68.4% in 2005. The value decreased till 2018, then increased to about 68.7% in 2021.
- In a report by OECD, the gender gap in employment rates went from 18% in 2000 to 10.5% in 2021 (on average) in most OECD-registered countries. Poland, Spain, and Sweden were a few exceptions where a notable decline was recorded.
- Accountability Lab revealed that for women who do not seek jobs, 83% claimed that the main reason was housework and child duties.
- According to a report from the OECD, most countries have higher median wages for men than women. The average difference for most countries exceeds 15% and goes above 20% in others.
Importance of Studying Gender Differences in Employment
Gender differences in employment can be seen in many aspects of job quality, such as wages, working hours, working conditions, training opportunities, promotion rates, relationships with colleagues, and work-life balance.
As BioMedCentral states, women are more likely to be employed with lower salaries, less chance of promotion, and worse social protection than men. These disadvantages in the labor market force women to have lower job expectations.
The GSDRC department of the University of Birmingham published a report in 2011 on Gender Differences in Employment and Why They Matter. It highlighted that although female labor force participation has progressed over the past 25 years, there is still obvious gender segregation in productivity and earnings. Time constraints and limited resource access bind women to productivity traps and market failures. Thus, the report states fewer workers will support older people in future decades unless labor force participation for low-rate groups (mainly women) increases.
In conclusion, gender equality in employment is not just morally justified but also increases a country’s economic standing. By not favoring one gender over the other, companies can acquire different talents and improve their performance significantly.
Overview of Male vs Female Employment Statistics
The World Bank published data comparing female to male labor force participation rates based on ILO statistics from 1990 to 2021. Female participation rates have always been lower than males. The ratio rose from 67% in 1990 to around 68.4% in 2005. It decreased till 2018, then increased to about 68.7 in 2021.
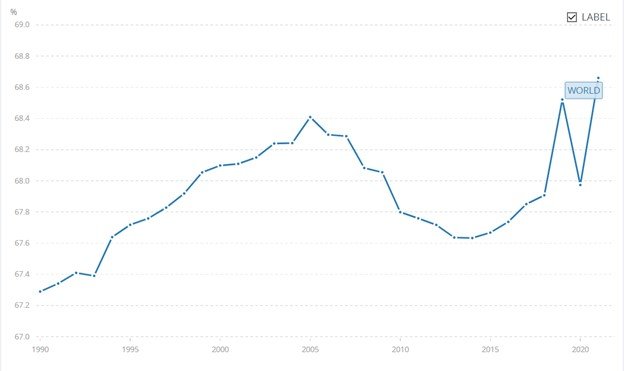
The Ratio of Female to Male Labor Force Participation Rate (%)
Source: The World Bank
Global Gender Employment Trends
According to the OECD, the employment rate is the number of working-age people in employment divided by the total working-age population.
In all OECD countries, men’s employment rates are higher than women’s. However, the gender gap in employment rates has narrowed in nearly every country.
Turkey, Hungary, Finland, Sweden, and the Czech Republic are the only countries where the gap between male and female employment rates has widened since the 1990s.
Historical Male and Female Employment Rates
- The International Labour Organization published global employment trends for youth in 2022. In 1995, the employment-to-population ratio for women was 41.3%, whereas, for men, it was 56%. The gender gap was highest in lower-middle-income countries, with a difference of around 25%, and lowest in high-income countries, with a difference of about 5%.
- Another report by the ILO showed the global employment trends for females and males. In 1993, 948 million females were employed compared to 1,425 million males. By 2003, 1,130 females were in employment compared to 1,661 males.
- According to the World Bank, the ratio of female to male labor force participation was 67.3% in 1990. The rates barely increased in 1993 to 67.4% and reached 67.9% in 1998.

The ratio of Female to Male Labor Force Participation Rate (%)
Source: The World Bank
Recent shifts in gender employment patterns
- Statista Research Department published data in October 2022, showing the employment rates of males and females worldwide since 2000. Employment rates of males have been consistently higher than women, the gap barely narrowing in the two decades.
In 2000, the employment rate for males was around 73% compared to nearly 48% for females. Trends slightly decreased for both genders till 2019, after which there was a significant decline in 2020. The rates for both genders increased till 2022 (67.86% for males and 43.82% for females) but were overall lower than in 2000. However, the gender gap in employment rates remained approximately the same over the years.
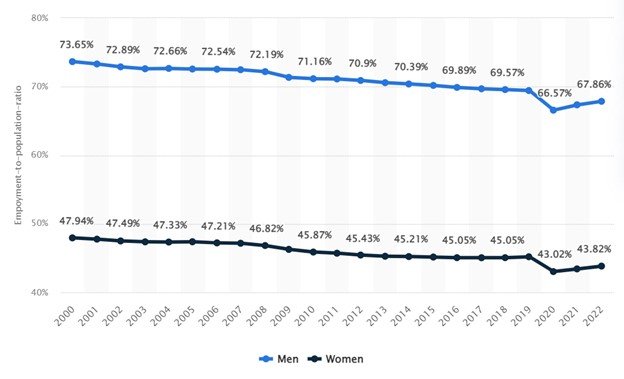
Estimated Employment-to-Population Ratio Worldwide in 2022, by Gender
Source: Statista
- The World Economic Forum released a global gender gap report in 2022. It analyzed gender parity in labor force participation for 102 countries. The data shows that gender parity decreased significantly between 2020 and 2022, at 62.9% – the lowest rate recorded since the data was first compiled.
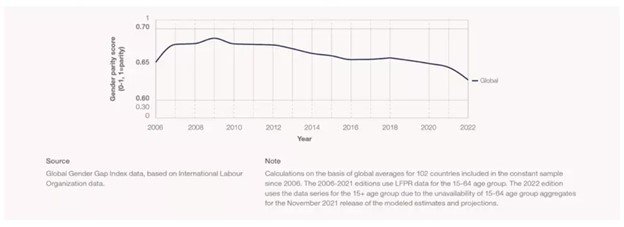
Labor Force Participation Gender Gap (2006-2022)
Source: WEForum
- According to OECD, the gender gap in employment rates went from 18% in 2000 to 10.5% in 2021 (on average) in most OECD-registered countries. Poland, Spain, and Sweden were a few exceptions where a notable decline was recorded.
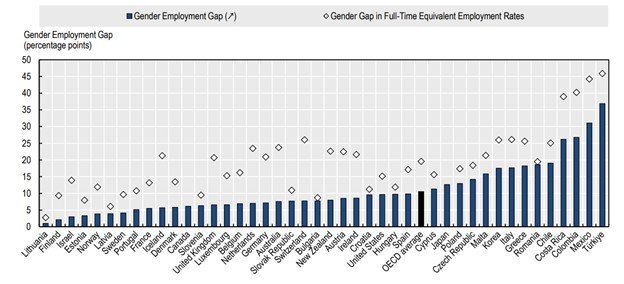
Gender Employment Gap (men minus women), 2021 (15-64-year-olds)
Source: OECD
Regional differences in male and female employment rates
- In 2004, The International Labour Organization published a report showing labor force participation rates by gender and region. The gender gap was the highest in the Middle East, North Africa, and South Asia between 1993 and 2003, where the female labor force participation rates were the lowest. On the other hand, East Asia had the highest female participation rate and the lowest gender gap.
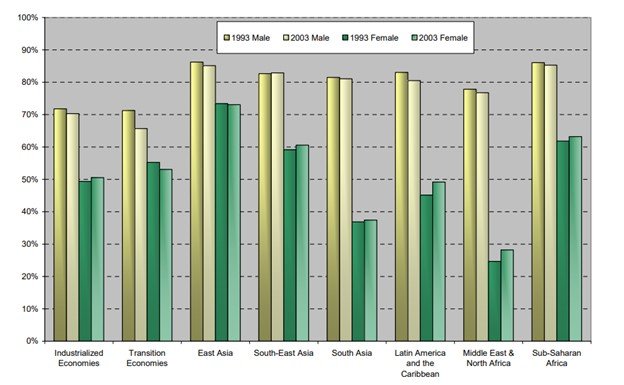
Labor Force Participation Rates, by Sex and Region, 1993 and 2003
Source: ILO
- Our World in Data compares the ratio of female to male labor force participation rate in 1990 and 2021. The percentage increased for most countries, but significant declines were recorded in others.
- Afghanistan: 19.6% in 1990 to 22.32% in 2021
- Australia: 69.12% in 1990 to 86.55% in 2021
- Bangladesh: 29.96% in 1990 to 44.26% in 2021
- Chad: 80.68% in 1990 to 67.09% in 2021
- Costa Rica: 39.98% in 1990 to 66.81% in 2021
- Ireland: 51.34% in 1990 to 82.43% in 2021
- Romania: 81.36% in 1990 to 68.65% in 2021
- Yemen: 22.22% in 1990 to 8.86% in 2021
Industries with Predominant Male or Female Employment
According to a Frontiersin report, Science, Technology, Engineering, and Math (STEM)-related professions are traditionally male-dominated. In 2018, 24% of females graduated with a STEM degree from a university. Among science graduates, 71% of men work in physics, math, and engineering-related professions.
Male-dominated Industries and Occupations
- An Our World in Data report shows that male participation in labor markets is higher than females. The female-to-male ratio of labor force participation rates from 1990 to 2021 for some countries is shown below:
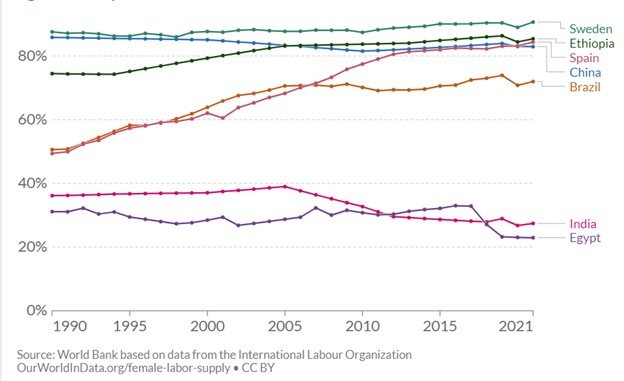
The Ratio of Female to Male Labor Force Participation Rates (1990 to 2021)
Source: Our World in Data
- An ILO Stats report shows the occupations by gender of 121 countries in 2020. Generally, men dominated the engineering and management occupations and other traditionally more risky jobs such as mining, construction, and transport.
- Building and related trades workers: 97% males
- Drivers and mobile plant operators: 97% males
- Armed forces occupations: 95% males
- Science and engineering professionals: 84% males
- Information and communication technicians: 81% of males
- Chief executives, senior officials, and legislators: 72% of males
- Careersmart has published an occupational breakdown by gender, showing the proportions of males and females in each profession in 2022. The highest male workforce was in sales and retail, with 497,285 workers. Other male-dominated professions are shown below:
1. Mechanics and Electricians
- Vehicle technicians, mechanics, and electricians: 99.19% of males
- Electricians and electrical fitters: 98.27% of males
- Electrical and electronics technicians: 96.4% of males
- Metalworking machine operatives: 92.73% males
- Plumbers and heating and ventilating engineers: 98.05% males
2. Drivers
- Fork-lift truck drivers: 97.36% males
- Large goods vehicle drivers: 97.34% males
- Taxi, cab drivers, and chauffeurs: 95.34% of males
- Train and tram drivers: 94.68% of males
- Bus and coach drivers: 92% males
- Other drivers and transport operatives: 88.92% males
3. Construction Occupations
- Carpenters and joiners: 98.97% males
- Elementary construction occupations: 96.9% of males
- Construction and building trades: 95.83% of males
- Painters and decorators: 94.98% males
- Product managers and directors in construction: 88.34% males
4. Engineers
- Electrical Engineers: 93.79% males
- Mechanical Engineers: 93.24% males
- Electronics Engineers: 92.65% males
- Aircraft pilots and engineers: 90.7% males
- Civil engineers: 89.96% males
- Engineering professionals: 88.95% males
5. IT
- Telecommunications Engineers: 95.38% males
- IT Engineers: 93.22% males
- Information Technology and telecommunications directors: 88.53% males
- IT business analysts: 82.51% males
6. Finance
- Vehicles and parts salespersons: 84.25% males
- Estimators, valuers, and assessors: 76.47% of males
- Debt, rent, and cash collectors: 71.94% of males
- Finance and investments analysts: 62.63% males
Female-dominated Industries and Occupations
- The ILO Stats report shows the percentage of employment by sex and occupation for 121 countries in 2020. Overall, there were fewer female-dominated fields than males. Females comprised most of the healthcare and service-providing careers.
- Personal care workers: 88% females
- Health associate professionals: 76% of females
- Cleaners and helpers: 74% of females
- Health professionals: 69% of females
- Teaching professionals: 68% females
- Customer service clerks: 66% females
- According to Careersmart‘s occupational breakdown by gender, the female workforce is concentrated in care-providing professions, making up 800,902 workers in 2022. Other female-dominated careers are the following:
1. Healthcare
- Medical secretaries: 94.91% females
- Podiatrists: 86.32% females
- Nurses: 84.41% females
- Physiotherapists: 83.43% of females
- Veterinary nurses: 82.79% females
- Health associate professionals: 74.16% of females
2. Education
- Teaching assistants: 90.61% females
- School secretaries: 90.24% females
- Primary and nursery education teaching professionals: 86.69% of females
- Special needs education teaching professionals: 80.81% of females
3. Mental Healthcare
- Therapy professionals: 89.74% females
- Psychologists: 88.03% of females
- Counselors: 79.84% females
- Occupational therapists: 75.53% females
4. Care Providers
- Housekeepers: 89.42% females
- Care workers and home careers: 83.66% of females
- Senior care workers: 81.5% females
- Cleaning and housekeeping: 78.37% of females
- Houseparents and residential wardens: 78.21% of females
5. Informal Work (Unpaid Care Work)
According to Our World in Data, women spend more time doing unpaid care work than men. These services include care of the house, persons, and voluntary community work. Most labor participation statistics do not include informal work in statistics; however, it forms a large portion of the female workforce.
The following graph shows the female-to-male ratio of time devoted to unpaid care work in 2014. The proportion is substantially large in India (9.83), where gender disparity is very common, whereas the United States and Uganda have relatively lower values.
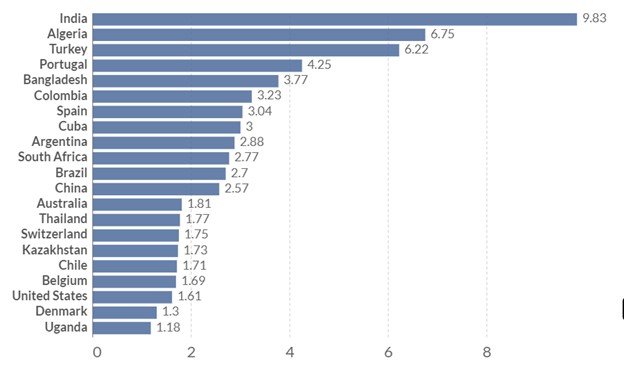
Female to Male Ratio of Time Devoted to Unpaid Care Work (2014)
Source: Our World in Data
Factors Contributing to Gender Imbalances in Specific Industries
1. Gender Stereotypes
Society pressures women to fulfill traditional roles, mainly house care and childcare. Thus, there is little to no time for women to look for other jobs outside the home. According to Accountability Lab, 83% of women do not seek employment due to housework and child duties.
UN News stated that stereotypical male and female roles are a leading reason for women forming almost 70% of healthcare occupations worldwide. Despite demanding working conditions, the health and care sectors have relatively low wages compared to others which is why men opt for other fields. Women, however, do not have the same liberty since they are underrepresented and have worse wages and working conditions in most other occupations.
Male-dominated fields and industries reinforce toxic gender stereotypes, making it harder for women to excel. Other gender stereotypes about women not belonging to the STEM fields have a lasting impact on gender imbalances in these occupations. Hence, women are discouraged from applying to male-dominated jobs.
2. Lack of Opportunities
Cultural perceptions that women are ambitionless, lack leadership qualities and are less committed to their careers greatly impact job opportunities for women. According to WEForum, older organizations, and workplace structures were designed to favor men. Due to the underrepresentation of females in workplaces in the past, women today have very few inspirations and role models to look up to.
Research shows that lacking role models discourages women from applying to senior leadership positions. Thus, there is a lack of female talent in certain fields, especially in STEM, where 32% of the graduates were females in 2016.
3. Gender Bias in Companies
Harmful HR (Human Resources) practices contribute greatly to gender imbalances in workplaces. A Frontiers report shows that gender discrimination in decision-making and the decision-makers’ level of sexism greatly impact HR practices. Workplace gender discrimination, coupled with lower pay and status, greatly affects women’s mental and physical health and their performance.
The Gender Pay Gap
Definition and measurement of the gender pay gap
According to a Statistics NZ report, the gender pay gap is a percentage of the difference between the average wages of men and women in the workforce. It measures pay equity between genders and determines whether women receive the same salaries for doing the same jobs as men.
To measure the wage gap, we subtract female wages from male wages, divide the difference by male pay, and multiply the answer by 100 to get the percentage. If there is no gender pay gap, the result would be 0%. If male wages are twice females, the result would be 50%.
Most resources prefer using hourly pay rates for calculations rather than hourly or annually. Hourly pay rates help compare male and female wages for a fixed amount of work, thus producing the most accurate results. Secondly, pay is affected by occupation and qualification; therefore, this information is kept constant when comparing the difference in wages for the two genders.
Global and regional trends in the gender pay gap
- According to the International Trade Union Confederation in 2017, women’s lower pay is a leading cause of female poverty worldwide. On average, a woman makes 77 cents for every 100 cents a man makes for the same work.
Despite increasing trends in female participation in the workforce, the gender wage gap has been consistent over the last 15 years. For example, in Japan and Korea, women earn 30% less than men for the same work, whereas, in Azerbaijan and Benin, the wage gap is more than 40%.
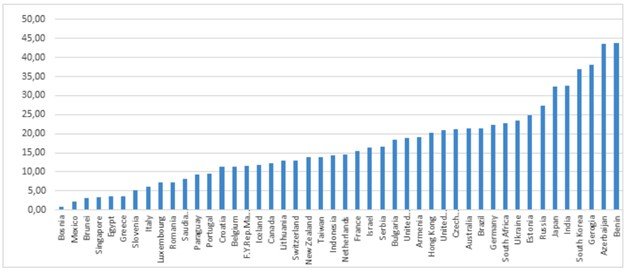
Gender Wage Gap in Hourly Wages (2017)
Source: ITUC
- A CNBC report determines the 5 industries with the largest gender wage gaps for Americans in 2022. The Finance and Insurance sector ranks first, where women make 77 cents for every 100 cents a man makes.
Agencies and Consultancies industry stand in second place at 83 cents.
Thirdly, the Healthcare industry has women earning 86 cents for every 1 USD a man makes followed by Transportation and Housing (87 cents), and lastly, Nonprofits (88 cents)
- According to an OECD report, most countries have higher median wages for men than women. The average difference for most countries exceeds 15% and goes above 20% in others.
In Korea, Japan, Germany, Switzerland, Canada, and the United States, male median earnings in full-time jobs are around 20% higher as compared to women. Since this data is only for full-time employment, it excludes many women working part-time. In other countries like Belgium, Poland, Greece, France, and New Zealand, the gender gap is less than 12%.
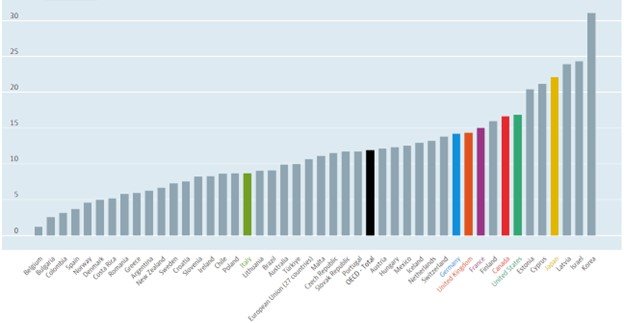
Gender Wage Gap 2022
Source: OECD
Factors contributing to the gender pay gap
An ITUC report shows the interconnected factors contributing to the gender pay gap. They are discussed below:
1. Overrepresentation of Women in Low-paying jobs
In most countries, women dominate fields with lower wages, such as healthcare, retail, and social work. On the other hand, men take up most of the high-paying jobs, such as the engineering, construction, and manufacturing industries. This disparity roots from many factors, mainly traditional gender stereotypes, which trap women with more household responsibilities than men. Thus, women tend to apply for more flexible and less time-consuming jobs, leading to lower pay.
2. Underrepresentation of Women in Managerial Positions
34% of businesses globally have no women in senior managerial positions. Global estimates show that women are more likely to work in jobs below their skill level, generally because of gender biases in companies. Female university graduates are also more likely to be overqualified for jobs than males in many countries.
3. Maternal Responsibilities
Globally, 75% of all unpaid care work is done by women. This makes them more likely to work part-time jobs rather than full-time jobs. The gender wage gap is even vast for parents. The motherhood penalty causes mothers to earn less than non-mothers, whereas the fatherhood bonus allows men to make more. These differences exist because women are more likely to pause their careers for household or childcare responsibilities. This affects women’s career progressions and limits their access to full employment and paid work.
4. Gender Discrimination
Direct gender discrimination is when companies do not hide wage differences according to gender. On the other hand, indirect gender discrimination is unconscious gender bias in workplaces. Gender discrimination is a major contributor to the gender wage gap.
Policies and Initiatives to Improve Gender Equality in the Workplace
Government policies promoting gender equality
1. Equal Pay
Equal pay for both genders can only be achieved once it is acknowledged that work is of equal value, whether performed by males or females. According to ILO data, the gender gap is at 20% for most countries. Government policies must address and rectify occupational segregation (especially in leadership positions). Conscious and unconscious gender discrimination can be tackled through education, communication, and public policies.
2. Pay Transparency
Pay transparency makes it easier for anyone to identify and compare gender disparities in pay. This exposes underlying causes and helps the government form policies to achieve equal pay. According to the ILO, pay transparency measures to help improve the gender gap and reduce gender inequalities in the labor market. It provides workers with evidence to negotiate wages and challenge gender discrimination in salaries.
3. Family-friendly policies
Family-friendly policies help reduce gender disparities in employment, thus improving the gender wage gap. They stop women from being forced into leaving jobs due to childcare and increase accessibility to care centers for children and older people. Family leaves should be gender-balanced to help women return faster to the labor market after giving birth. They also challenge traditional norms of women’s caretaker roles and encourage men to participate more in caring roles.
Examples of successful gender equality initiatives
An ILO report shows policies implemented by governments that have shown positive results in achieving gender equality:
- Iceland: The Equal Pay Certification Law (2018) requires companies to provide proof of equal pay between genders rather than enforcing equal pay after females are affected by lower wages. Since this law was passed, the World Economic Forum’s Global Gender Gap Index crowned Iceland “the most gender-equal country to date.”
- Sweden passed a Discrimination Act in 2008, which ensured equal rights for genders, including equal pay. It stated that for work of equal value, employers should prevent differences in pay for men and women.
- Switzerland: The Equality Act, amended in December 2018, requires all employers with over 100 employees to take an internal equal pay analysis. This analysis will be repeated every 4 years unless the first one shows no gender pay gap.
- The United Kingdom passed an Equality Act in 2010 (amended in 2016) to include gender gap transparency measures. Companies with 250+ employees must publicize their wages to analyze the size of any gender pay gap present. One year after this mandatory reporting, the pay gap in the UK decreased from 18.4% to 17.9%, proving its effectiveness.
- Spain: The Workers Statute Law in 2011 has basic laws for favorable working conditions for every employee. It mandates establishing minimum wages and maximum weekly working hours. Domestic workers are also eligible for social security, healthcare, maternity leaves, and more. Secondly, Spain passed a new pay transparency law in 2020, which requires companies to publicize employee wages.
FAQs
How does gender affect job satisfaction?
A 2019 IZA report reveals that on average, women have more job satisfaction than men.
Which gender works more hours?
According to Towards Data Science, men work longer than women, mainly because they are more available for full-time jobs.
What are the benefits of gender equality in workplaces?
An article by WGEA claims that workplace gender equality leads to improved economic growth and productivity, increased organizational performance, and increased probability for companies to attract talent and employees
Which region has the biggest gender pay gap?
According to Forbes, the largest gender pay gap is in Korea at 31.5%.
Conclusion
Around the world, finding a job for women is much tougher than finding one for men. Women tend to work in low-paying jobs with unfavorable working conditions. Thus, it is important to study gender differences in workplaces to identify and eradicate the contributing factors. Global gender employment trends show that the gender gap has slightly narrowed in recent years as compared to the past. However, it is still a major problem to overcome.
The gender pay gap has also decreased over the years, but there are still significant gender disparities in most occupations.